It does not matter the channels you utilise – be it print advertising, social media or email marketing – the call-to-action usually leads to a website where a conversion, either generating a lead or completing a sale, happens.
Before we go any further, let’s first define what conversion rate is. Conversion rate is defined as the percentage of visitors to your website who perform a desired goal, also referred to as the “conversion event”.
The conversion could be anything from filling in a lead form, buying a product, signing up for a newsletter to downloading a software trial. A simple equation for this is:
Conversion Rate (%) = Goal Conversions (#) / Visitors (#) x 100%
When it comes to calculating conversion rates, most people aren’t sure how to count the number of users and events. The problem is that people don’t know whether to count unique visitors or to count a person as many times as they visit during the measurement period. On conversion events, people do not know whether to only count a specific person once no matter the number of times they buy or count each person as many times as they buy.
Either way of counting is okay, just choose what works best for your site and stick to it. By this I mean use the method you choose during all measurement periods.
Now to the question of the day: What’s a good conversion rate?
This is a very common question, for which there isn’t a single definitive answer. All that can be said about this is that a good conversion rate for your site is one that is higher than your previous one. Simply put, it’s relative. This is because:
- Companies do not have the same pre-existing brand reputation. Keeping all other factors constant, conversion rates for loved brands will be higher than those for less reputable brands.
- Websites selling cheaper things will have higher conversion rates than those selling more expensive things.
- Impulse buys will have more conversion rates than items that require research and deliberation.
- Users are less open to commitment. It’s easier to get a user to read a couple of articles than to get them to sign up for an email newsletter. This is because people do not see the need to commit to something just to browse a website.
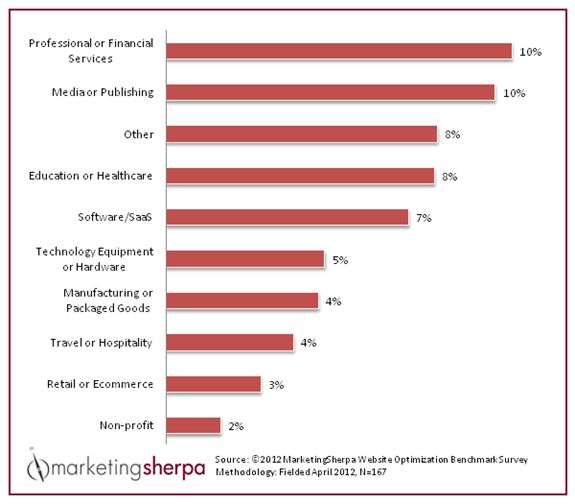
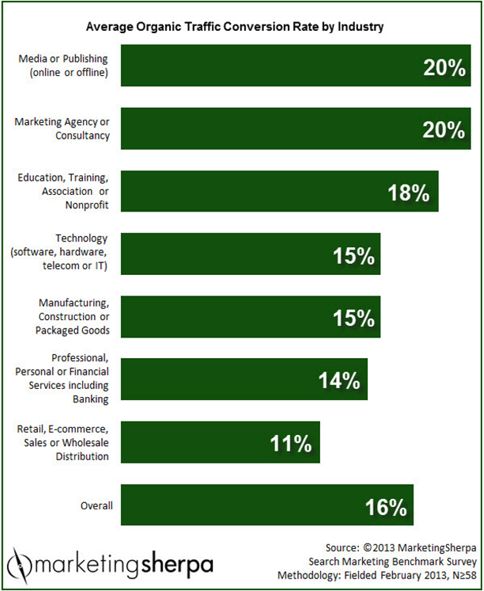
Conversion rates have continued to grow since the year 2000 as users become more comfortable with taking the desired action. For example in 2000 the conversion rate for e-commerce sites was about 1% but had reached around 3% by 2013. Other benchmark conversion rates for other industries are as follows:
Source: http://www.marketingsherpa.com/1news/chartofweek-10-23-12-lp.htm
Source: https://www.marketingsherpa.com/article/chart/conversion-rates-organic-traffic
How to use standard/benchmark industry conversion rate data
As I mentioned earlier, how conversion rates are measured differs from one site to the other. It all depends on the conversion events and these are different even for websites from the same industry. This makes consuming this data a bit tricky. So how should you use it?
Well, you can use this data as a less official yardstick of your performance, a general ballpark of where you would like your performance to be. But all in all, the best way to deal with your own conversion rates is to make sure that you improve on your previous ones.
Although the industry benchmarks cannot be completely ignored, it’s wiser to focus more on your own website’s performance. They may help you optimise certain stages in your funnel, but they shouldn’t be the ultimate measure of your marketing success.
Here’s a great video from Moz:
Sources:
http://www.widerfunnel.com/conversion-rate-optimization/why-your-conversion-rate-doesnt-matter-aka-conversion-rates-are-relative
http://www.nngroup.com/articles/conversion-rates/
http://www.marketingsherpa.com/1news/chartofweek-10-23-12-lp.htm


Leave A Comment
You must be logged in to post a comment.